SC2001 Bandwidth Challenge demo:
Bandwidth Greedy Grid-enabled Object Collection Analysis for Particle
Physics
Julian Bunn, Ian Fisk, Koen Holtman, Harvey Newman, James Patton, Suresh
Singh
Caltech and UCSD
Overview
This was a demo done on 12-15 November 2001 at Supercomputing 2001 in Denver. We demonstrated
a client/server application that allows particle physicists to interactively
analyse 105 GB of physics event data stored in two `tier 2
centers' that are part of a Virtual Data Grid system. The
demo showed some key elements of the CMS Data
Grid system that the CMS
particle physics experiment is building, in collaboration with several Data
Grid reseach projects like GriPhyN, PPDG, and the EU DataGrid.
With this demo we participated in the Supercomputing 2001 `bandwidth
challenge' event. We achieved a peak throughput of 29.06 Mbyte/sec from our two
tier 2 servers at Caltech and SDSC into the client machine at the Denver show
floor.
Bandwidth usage in the demo
Hardware used
We used two servers at Caltech (Pasadena, CA) and UCSD
(San Diego, CA). The two servers are shown below.
The Caltech server
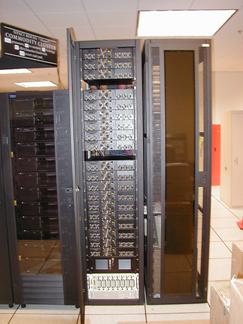
The USCD server
Details about the Caltech server are here.
The Caltech server had two 100 BaseT connections to a local router, and from
there to the CalREN and Abilene networks. The UCSD server had one 100 BaseT
connection. Of the two server installations, only the RAID arrays and front-end
server machines were used, not the computational nodes which take the majority
of the rack space in the pictures above.
The client machine is a standard dual-Pentium III PC running Linux. It is
equipped with 512MB memory, a Fast Ethernet connection to the SCINet routers on
the Denver show floor, and three Ultra SCSI3 disks.
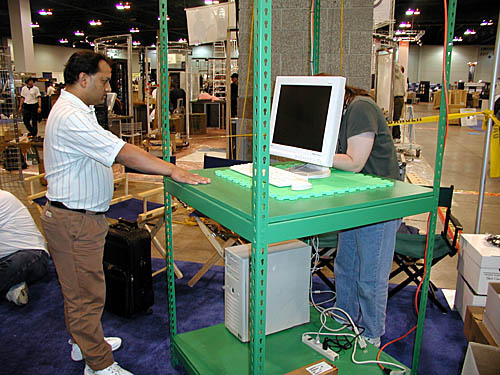
The client machine in the process of being set up in the Caltech CACR
booth in Denver.
On the left is Suresh Singh of Caltech.
Software used
The servers and the client machines were all running
Linux. We used the Objectivity/DB object
database system to store all physics data in terms of objects. The 105 GB of
physics data was generated with the CMS
production software, using the ORCA-defined object data model.
We used the Globus GSI FTP tools to move
bulk data between client and servers. To allow for grid-secured client-server
communications (without passwords in the clear) we used an extended GDMP server and the GSI security
libraries from the Globus project.
To support interactive physics analysis using `tag' data stored on the client
machine, we used a home-grown Java-based prototype physics analysis application.
To support analysis and replication of the data on the servers, we used a
home-grown C++-based prototype Grid application.
Data sets used
- We have 144,000 simulated QCD background events stored as FULL event
objects on 2 servers in the Grid:
- tier2.cacr.caltech.edu at Caltech (70 GB)
- t2cms0.sdsc.edu at UC San Diego (35 GB)
- Each of these FULL event objects represents the collision products of a
single high-energy particle collision inside the CMS detector.
- A single full event can be visualised with the COJAC tool, as shown below.
COJAC showing all tracks in a FULL event (white lines) inside the CMS
detector.
Only parts of the CMS detector are visualised here.
- We have 144,000 virtual LARGE objects, each is defined as being the
result of applying a feature extraction algorithm to an existing FULL event
object.
- These are virtual objects in the sense of the GriPhyN project, they have:
- Virtual existence: the application that requests to read the the object
does not care if object has been computed yet. If our demo, if the object
has not been computed yet, it is computed and cached on the server machine
which holds the corresponding FULL object.
- Virtual location: the application that requests to read the object does
not care if the object is present locally yet. In the client, all requested
objects are obtained from the appropriate server, and then stored in a local
cache.
- The complete data flow and caching arrangement is shown below.
Representation of the server and client datasets and caches, and
the
dataflow arrangement between them, as shown on screen during the demo.
The two purple boxes on the left represent the FULL data volumes. The boxes
with purple bargraphs
in the middle and on the right are the caches for the
LARGE objects. The black boxes with yellow
plots show a history of the data
rates into these caches.
- We have 144,000 TAG objects on the Denver client, one for each
event, which can be used to select interesting events.
- These TAG objects are individually very small (a few tens of bytes), so
144,000 of them are only 30 MB, fitting easily on the client disks.
- The physicist uses queries on the summary data present in the TAG objects
to select a set of LARGE objects for further detailed analysis.
- This querying and selection is done with the tag browser shown below.
The two windows of the tag browser running on the client machine.
In
this picture, 497 events have been selected out of the 144,000 available
ones
by a combination of the predicate `part5E > 200' and the use of a
`rubber band' selection
in the scatterplot in the lower left corner. The
`rubber band' is the yellow box.
Virtual Data Grid API
The demo software implements a virtual data grid
API, an API that is central to the CMS computing model and the GriPhyN project.
After some events and corresponding LARGE objects have been seleced with the
above tag browser application, the client application does requests access to
these LARGE objects by doing a call on the local Virtual Data Grid API. This is
shown in the picture below. The grid software, which runs on both the client and
the server machines, is responsible for obtaining local copies of the LARGE
objects. The Grid software returns and iterator, which the application can use
to access the objects and plot some information in them.
The virtual data grid API as implemented in the demo
Whether or not (some of) the requested objects exist locally is completely
transparent to the client application. The grid software will compute and
perform the minimal actions that are necessary to fulfill the request. If some
of the requested objects are already cached locally, only the missing ones will
be transported over the network.
The
same set of LARGE objects is requested twice, but with
differences in the
contents of the caches. The graph shows the bandwith to fulfill the
requests.
At the start of the first request, all caches are empty. Between
the first and second
request, the client cache contents are manually deleted,
but the
server caches are left intact.
Network details
See the hardware details above for a description of the
network intefaces on each of the machines. To transport the bulk data with
GSIFTP, we used 6 parallel TCP/IP streams, 4 from the Caltech server and 2 from
the San Diego server. We used `large windows' on all streams, for the Caltech to
Denver streams we used a window size of 400 KB, computed with the formulae
RTT * link bandwidth. The complete route from Caltech to the Denver
client is shown below. traceroute to tier2.cacr.caltech.edu (131.215.144.56), 30 hops max, 38 byte packets
1 B-rtr.R340.showfloor.sc2001.org (140.221.196.222) 0.320 ms 0.255 ms 0.189 ms
2 core-rtr-2-sw-rtr-4a.scinet.sc2001.org (140.221.128.73) 0.345 ms 73.582 ms 7.058 ms
3 140.221.128.54 (140.221.128.54) 0.246 ms 0.189 ms 0.175 ms
4 snva-dnvr.abilene.ucaid.edu (198.32.8.1) 24.813 ms 24.817 ms 24.785 ms
5 losa-snva.abilene.ucaid.edu (198.32.8.18) 32.242 ms 32.245 ms 32.218 ms
6 USC--abilene.ATM.calren2.net (198.32.248.85) 32.462 ms 32.547 ms 32.490 ms
7 ISI--USC.POS.calren2.net (198.32.248.26) 33.062 ms 32.959 ms 33.044 ms
8 UCLA--ISI.POS.calren2.net (198.32.248.30) 33.527 ms 33.462 ms 33.580 ms
9 JPL--UCLA.POS.calren2.net (198.32.248.2) 34.296 ms 34.083 ms 34.133 ms
10 CIT--JPL.POS.calren2.net (198.32.248.6) 35.649 ms 35.604 ms 35.762 ms
11 Caltech-CalREN.caltech.edu (192.41.208.50) 35.602 ms 35.907 ms 35.781 ms
12 CACR-rtr.ilan.caltech.edu (131.215.254.145) 34.738 ms 34.755 ms 34.840 ms
13 tier2.cacr.caltech.edu (131.215.144.56) 35.116 ms 34.536 ms 34.421 ms
The picture below shows how the network connections used in the demo
relate to the multi-tier structure of the entire planned CMS data grid system.
Data flow in the demo, related to the multi-tier structure of the
entire
planned CMS data grid system.
More demo pictures
Conclusions
In this demo we showed
- Physics analysis using a virtual data API
- This is a central API in the CMS experiment computing model
- Virtual data is the focus of the GriPhyN project
- Implementation of the virtual data API using Grid technology
- Integration of Grid technology with experiment's Object Oriented Database
technology
- Seamless, easy access to data, which is needed to:
- give all CMS physicists equal access
- succesfully exploit all distributed computing resources
We achieved a peak throughput of 29.06 Mbyte/sec from our
two tier 2 servers at Caltech and SDSC into the client machine at the Denver
show floor.
Koen Holtman, 31 Dec 2001. 