Modelling an Average Physicist with ModNet
Modelling Data
The following table (from Stu Loken) shows the expected tasks of an "average" physicist in 2005:
| Task | Hours Per Day | KBits/sec | Total Mbits | |
| Conferencing | 2 | 512 | 4,000 | |
| "Coffee Room" | 0.5 | 2,000 | 4,000 | |
| Seminar | 0.4 | 1,000 | 1,600 | |
| Remote Sessions | 2 | 256 | 4,000 | |
| Analysis, Including Transfer in background | 4 | 700 | 10,000 | |
| Electronic Notebooks | 2 | 100 | 800 | |
| Papers: 20 Papers and Documents, Including Links | 2 | 100 | 800 | |
| E-Mail: 500 Multimedia Messages | 2 | 50 | 400 | |
| Interactive Virtual Reality | 0.5 | 2,000 | 4,000 | |
| TOTAL MBits Transferred Per Day | 30,000 | |||
| Average Mbps During a Ten Hour Day | 0.75 |
Our aim is to verify whether the tasks above do indeed give rise to network traffic averaging 0.75 Mbps, and to show the traffic fluctuations over the course of the day. We would also like to model a group of physicists using the above data, and see what the network implications are.
Setting up the Model
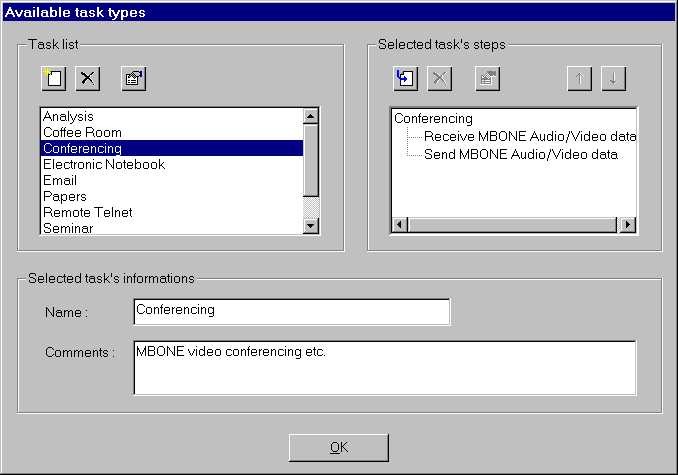
To model this user with the ModNet tool, we set up tasks with the same names, which will execute at the required frequency. We choose a work day as being 10 hours long. To model the tasks, we examine what happens each second, when the user is engaged on that task. For example, the "Conferencing" task involves sending and receiving audio/video data. In one second, we say that 512 KBits of data are received, and in the next second 512 KBits of data are sent (this should probably be changed to an 80:20 rule in favour of data reception, but for the moment we keep it simple). The task in ModNet looks like this:
The two task steps "Receive MBONE Audio/Video data" and "Send MBONE Audio/Video data" are defined in terms of data size and location:
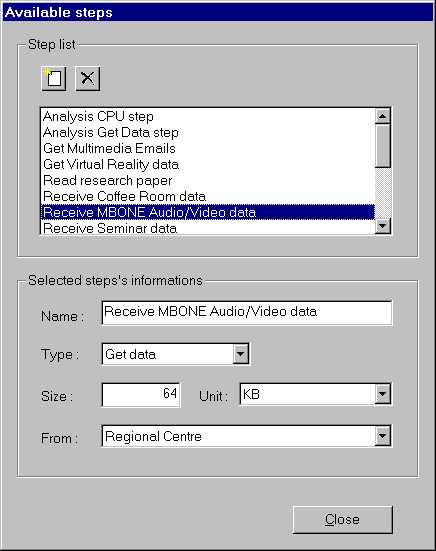
Note that the data comes from "Regional Centre", and the size of the data is specified in units of KBytes.
The physicist is "Conferencing" for 2 hours every day. There are 7200 seconds in 2 hours, so the above task must be invoked 7200 times over the course of the day. (We are assuming that the physicist is multiplexing between all the different tasks, at the rate specified by Loken's table).
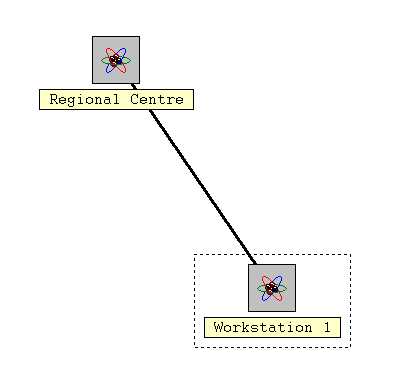
The user works on a single workstation, which is connected to the "Regional Centre" via a network of semi-infinite bandwidth. The completed network model looks like this:
Results
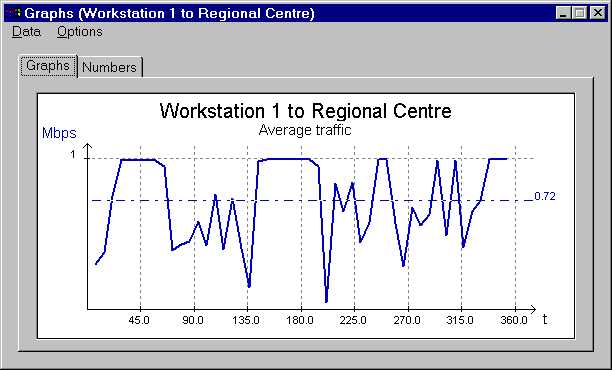
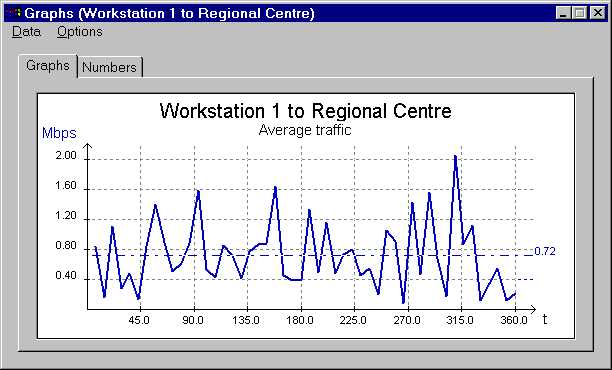
A graph of the network traffic between the physicist's workstation and the "Regional Centre" shows the expected average rate of ~0.72 Mbps. (Note the spikiness of the traffic, peaking at 2.05 Mbps and with a low of 0.09 Mbps).
Now if we modify the network so that it runs at 1 Mbps, we obtain the following traffic pattern: